


A digital overhaul
Dec 2022 - Jun 2023
Timeline:
Scope:
Tools:
Site redesign
Python, Figma, DALL-E, Premiere, Webflow
Dec 2022 - Jun 2023
Timeline:
Scope:
Tools:
Site redesign
Python, Figma, DALL-E, Premiere, Webflow
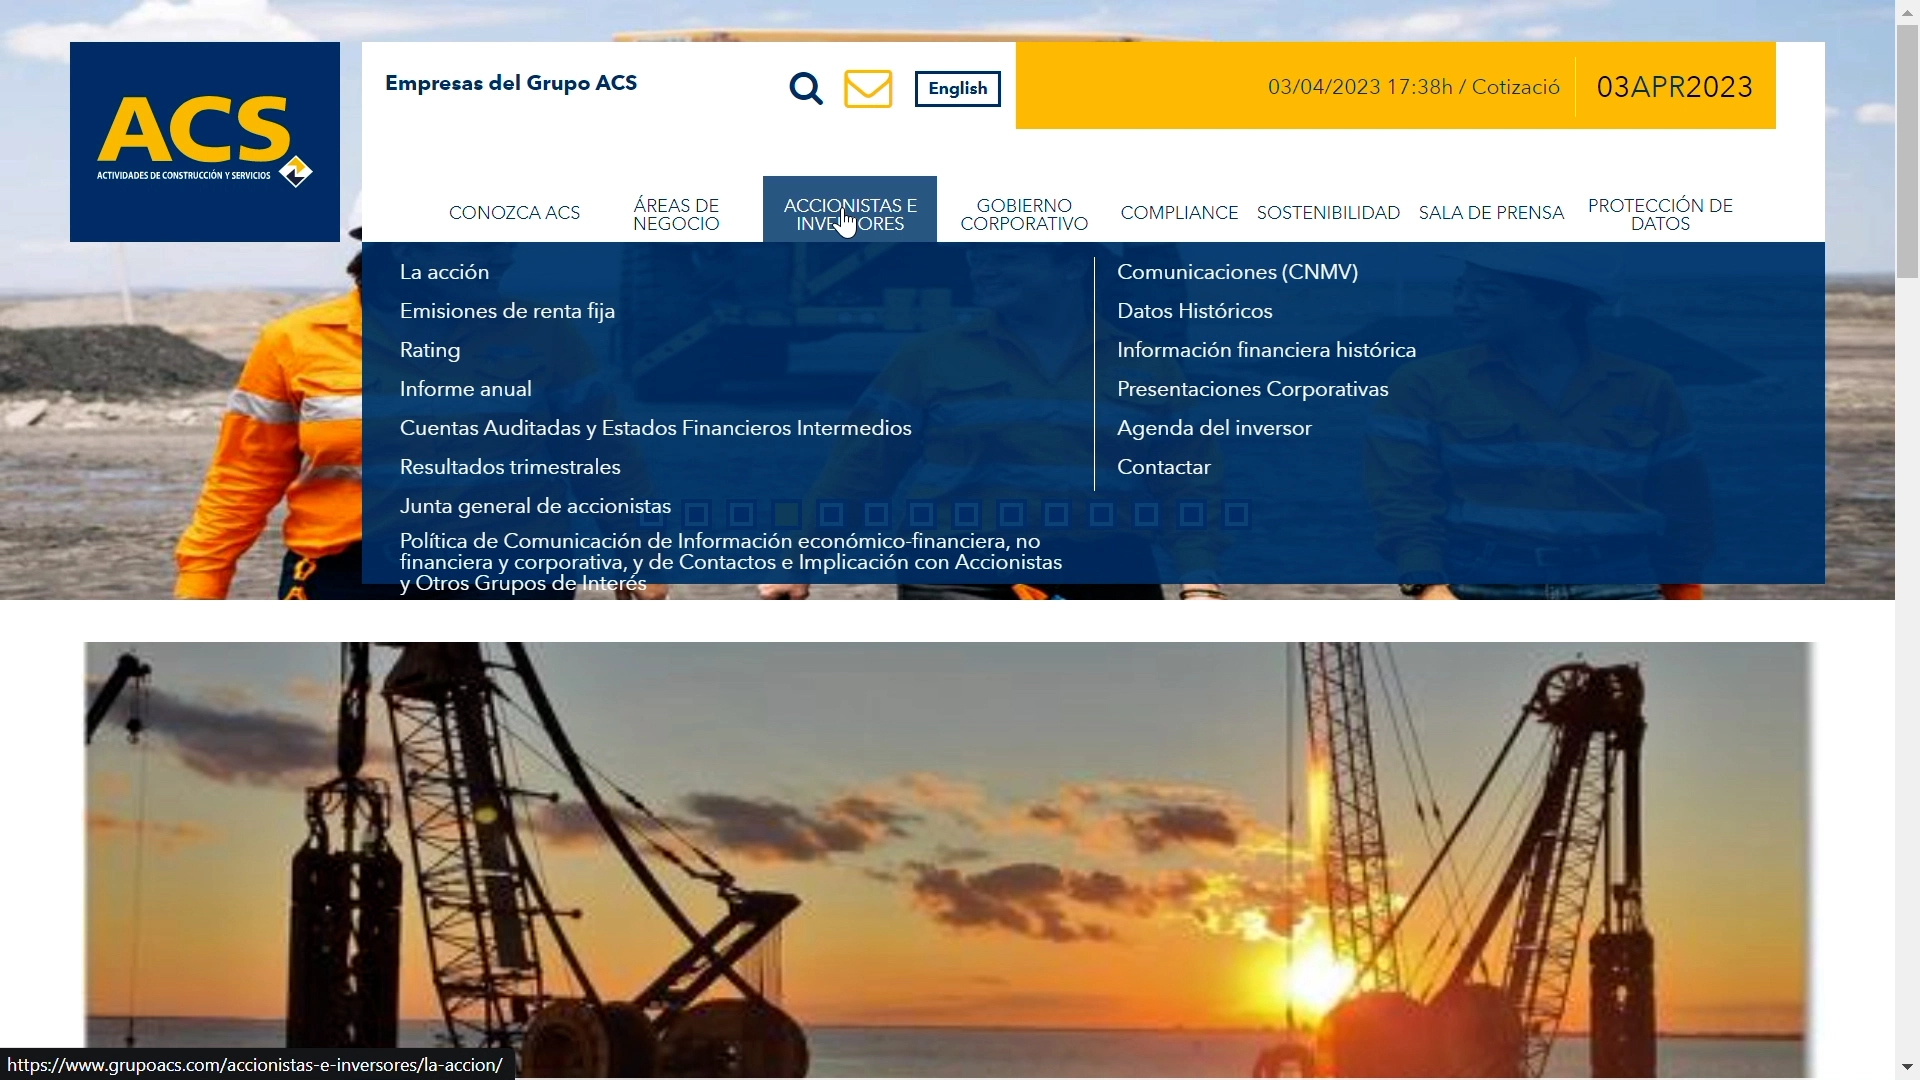
Here's how I helped ACS Group increase their NPS score by 86% and their Time on Page by 780%.
The first step was to gather secondary and primary data, both qualitative and quantitative.
We assembled four secondary sources and designed a complementary survey to collect primary data.


We merged the demographic and survey data to identify the age, gender, and income distributions of ACS’s audience.
These statistics established measurable milestones for the size and potential of ACS's market.

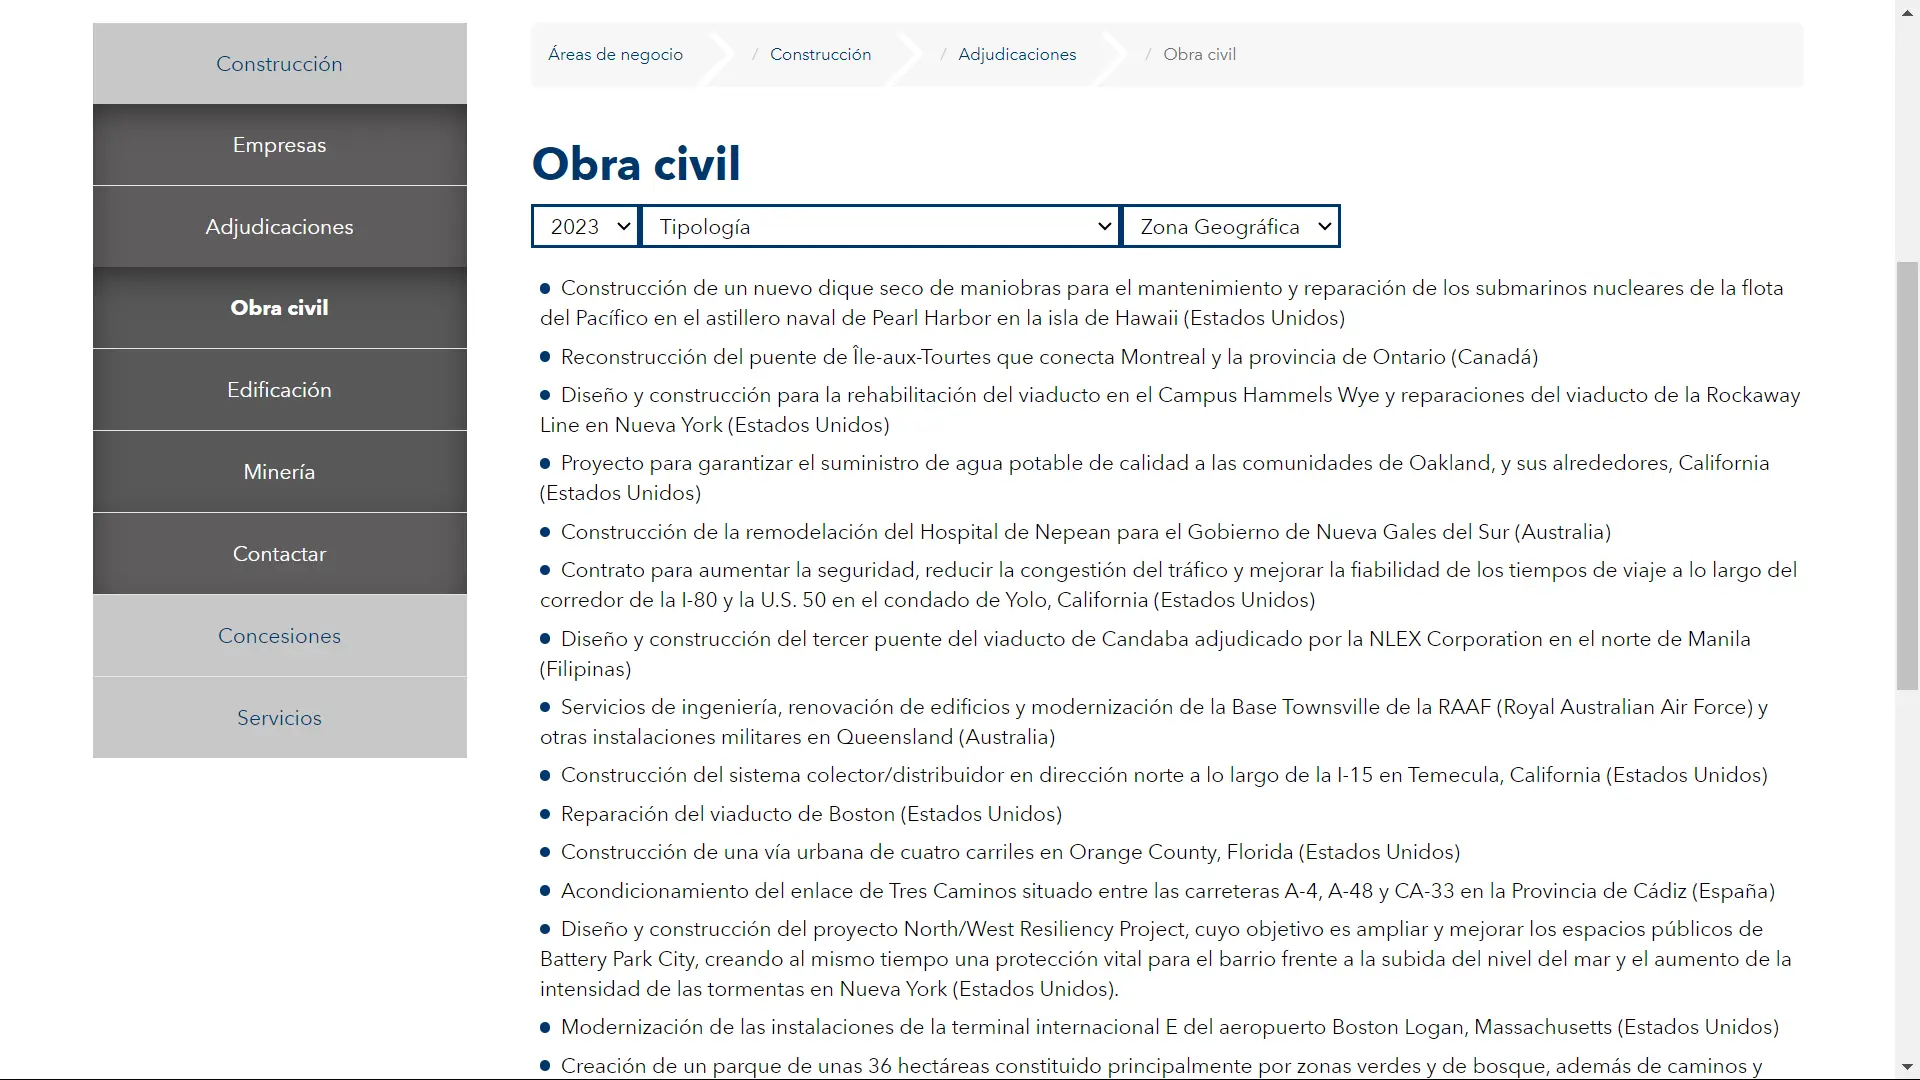
The survey data also let me evaluate user frustrations and expectations when using the ACS website.
With the survey responses, we mapped an aggregate user journey to better grasp the collective user experience and to pinpoint critical interactions.

To push analysis further, we reduced the dataset into operable feature vectors. These are the basic objects that enable more advanced ML methods and let me derive user insights.
Here, as an example, we graphed one feature (investment criteria) ranked by reported importance.

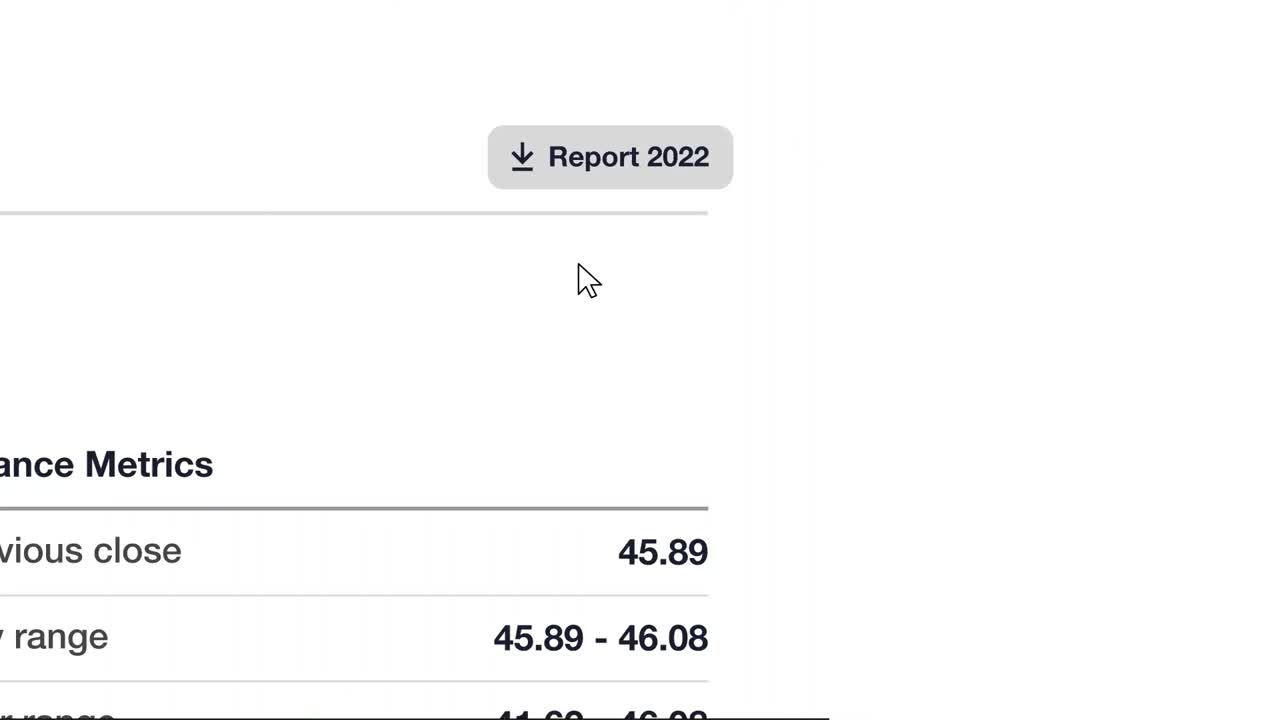
Quantifiable metrics allow users to evaluate the ACS stock analytically. Since ACS users primarily use the site to research the ACS stock, quantitivity is their biggest priority.
Measured by (KPIs):
After quantitivity, ACS users most value clarity. A clear UI allows users to analyze company data without growing overwhelmed. This is especially important when displaying complex datasets, as is often the case with ACS.
Measured by (KPIs):
The final statistically significant quality is exhaustivity, meaning complete and thorough reporting. Comprehensive reports of company operations are key for users to reliably analyze and forecast performance.
Measured by (KPIs):
We wondered...
Quantitativity
As the core feature of the site, we designed a comprehensive dashboard that displays all financial reports in one page. Here, we made sure to include every metric that users mentioned to have had struggled finding.

Exhaustivity
To maximize the site's clarity and exhaustivity, we designed an opt-in RSS blog, once again built on top of an CMS system.
This, like all newsfeeds, is intended to inform and engage users, but also to begin the SEO process by promoting the website's authority and search engine visibility.


The reduction in bounce rate suggests that users were more willing to explore the site. Because most traffic arrives at the homepage, it also shows that the homepage was particularly more effective in directing user flow.

The reduction in exit rate is another strong indicator of user engagement. It shows that users were successfully guided towards the site's core features and were presented with enough opportunities to explore further.

The spike in time-on-page shows that the prototype was much more effective in capturing and retaining user attention. As expected, the new finance dashboard made up a significant portion of this increase.

This was not expected. It seems that the abundance of short pages in the original site may have inflated its scroll depth. However, a 34% decrease does indicate reduced user interest and should be investigated in future iterations.

The 61 point increase in the System Usability Scale shows that the new user interface, information architecture, and content packaging were significantly more intuitive and successfully improved usability and the user experience.

A Net Promoter Score of 12 reflects a new overall positive sentiment towards the site, and shows that users were more charitable in recommending the website to their friends and collegues.
The reduction in bounce rate suggests that users were more willing to explore the site. Because most traffic arrives at the homepage, it also shows that the homepage was particularly more effective in directing user flow.
The reduction in exit rate is another strong indicator of user engagement. It shows that users were successfully guided towards the site's core features and were presented with enough opportunities to explore further.
The spike in time-on-page shows that the prototype was much more effective in capturing and retaining user attention. As expected, the new finance dashboard made up a significant portion of this increase.
This was not expected. It seems that the abundance of short pages in the original site may have inflated its scroll depth. However, a 34% decrease does indicate reduced user interest and should be investigated in future iterations.
The 61 point increase in the System Usability Scale shows that the new user interface, information architecture, and content packaging were significantly more intuitive and successfully improved usability and the user experience.
A Net Promoter Score of 12 reflects a new overall positive sentiment towards the site, and shows that users were more charitable in recommending the website to their friends and collegues.
This page is under development. Check back soon!


.png)